STIPSI - A Sampling Simulator for Forest Stands and Forest Areas
Results
[ ]
[ ]
[ ]
[ ]
[ ]
Presentation of the Results
You can display, print and/or save the most important analysis results of the sampling simulation for both alternative inventory methods in clear graphical and tabular form.
|
|
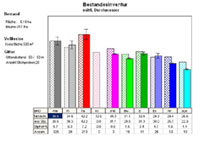
Stand-wise inventory: Mean DBH for all tree species
|
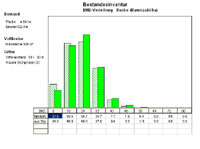
Stand-wise inventory: Stem distribution for beech
|
For visually optimal illustration, the most important parameters are displayed as a bar chart. This applies to the basal area/hectare, mean DBH, stem distribution, and in the case of the unit inventory, also for the grown area/hectare. For better comparability, the results of the samples (filled) and a complete inventory count (half-toned) are displayed as back-to-back column pairs in the corresponding species colour.
|
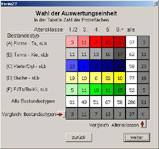
Area-wise inventory: Matrix for selecting analysis unit
|
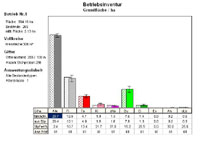
Area-wise inventory: Basal area/ha for all stand types of age classes 1 & 2
|
The unit of analysis with the classic stand inventory is a single stand at a time. In contrast, a greater number of analysis units are possible with the area inventory according to stand type/age class. The user makes a decision on the basis of a coloured decision matrix.
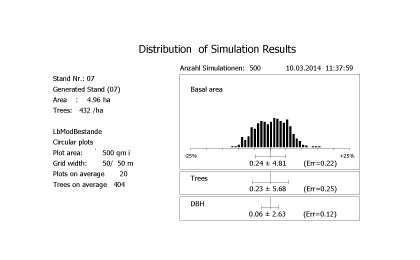
The simulation is repeated with up to 2000 times with randomly replaced grid position. Results are currently displayed in the window "Distribution"
For both alternative inventory methods the main results are summarized, including the statistical parameters partly in the footnote of the graphs and partly in separate basis tables. For the stand inventory a list of the method-specific measurement values for every single sample point can be requested additionally.