STIPSI - A Sampling Simulator for Forest Stands and Forest Areas
Programme[ Overview ] [ Programme - Stand-wise Inventory ] [ Results ] [ User Group & History ] [
Program Elements and Procedures
Distinct differences exist between the basic concept and procedures of stand-wise and area-wise inventory sampling, which will be described separately in the following text.
Stand-wise Inventory:
 Stand-wise Inventory
Area-wise Inventory:
The digitized forest stands in the form of forest areas or entire forest enterprises and a series of stand models takes centre stage here. With the digital forest, two functionally associated levels are distinguished: the actual program level for running the program are 3 alternative forest areas with fixed external boundaries and a fixed compartment network, but variable section-wise stand boundaries, as well as a second modifiable level of stand models from the user before the start of a simulation with coordinate-based actual measured and simulated tree distributions respectively.
After the selection of a forest area the user has to generate a combined stand type/age class map. For this, the desired stand types are determined based on percentages and mixture as well as the age class structure of the unit. All steps are documented with a visually-optimized map.
Next to be applied is the selection of the stand models. Three categories of stem distribution maps can be accessed for every simulation: 46 actual measured stands, stand models created by the user with the generation module, as well as a mixture of actual and generated stands. For purposes of education and training, the use of the collective of 71 stand models is recommended, since it makes the simulation possible without further preliminary work. Also in this phase of the operation as transparent and realistic to design as possible, both statistics about the distribution of the stand models based on stand type and age class, and also for every single stand model of the associated stem distribution map inclusive of the most important stand values can be viewed.
After selection of one of the four field-tested sampling methods, the user can overlay the modifiable and rotatable sampling grid on the forest area map displayed on the monitor. A window shows all important information about the sampling methods, the selected grid density and the number of samples for the unit. Every single sample in the site plan of the measured sample trees can be displayed diameter proportionally in the respective species colours. Important to note is that the actual sampling occurs not at the program level of the forest area map, but rather at the level of the stand models assigned to the single stand types and age classes.
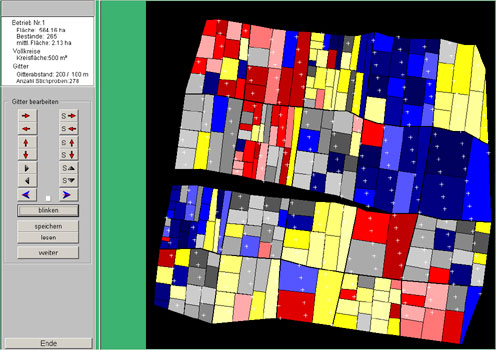
Stand-wise inventory: Circular plots 0.025ha
![]()