STIPSI - A Sampling Simulator for Forest Stands and Forest Areas
Programme[ Overview ] [ Programme - Area-wise Inventory ] [ Results ] [ User Group & History ] [
Program Elements and Procedures
Distinct differences exist between the basic concept and procedures of stand-wise and area-wise inventory sampling, which will be described separately in the following text.
Stand-wise Inventory:
The digitized international forest model of 46 forest stands from 7 countries (A, CH, CDN, D, SK, TR, USA) takes centre stage. The stands of this stored forest complex distinguish, among other things, age, species composition and structure. With the integrated generation module this real forest can be adjusted by the user into many simulated stands.
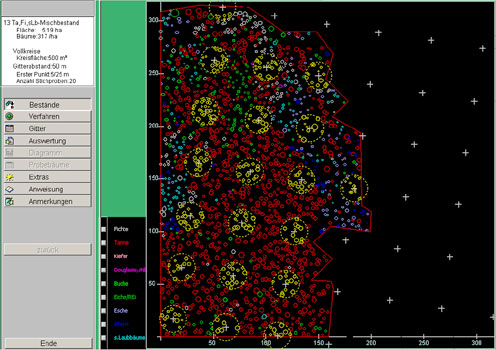
In the field of inventory procedures a compulsory survey for determination of sampling methods and designs will be replaced with an optimal visualization of all necessary information on the PC. A superimposed stand description informs the user about age, species composition and other characteristics of the selected stand. A slide show conveys a visual impression of the actual situation. Especially impressive, the site plan reflects the spatial distribution of trees whose X/Y coordinates are precisely measured in cm. The basal area at breast height displayed in different colours allows the user to identify the distribution of the species based on species mixture and form in a single view.
After completion of the simulated forest survey the user has all necessary information to develop a stand-optimized sampling design at their disposal. The selection of an appropriate representative sampling method requires an interactive procedure. At first the simulator analyzes the suitability of the sampling method recommended by the user for the concrete stand and makes critical comments. The procedure can be repeated until the appropriate method, and suitable alternative methods respectively, are found. The sampling design is completed with the fixation of a modifiable and rotatable quadratic grid network. The close menu shows the assigned sampling arrangement in the tree distribution map with the colours of the highlighted sample trees.
For scientific interest, the "true" variance and optimal sampling design for the circular plots of selected stands are generated via special functions.
Stand-wise inventory: Circular plots 0.025ha
![]()
 Area-wise Inventory